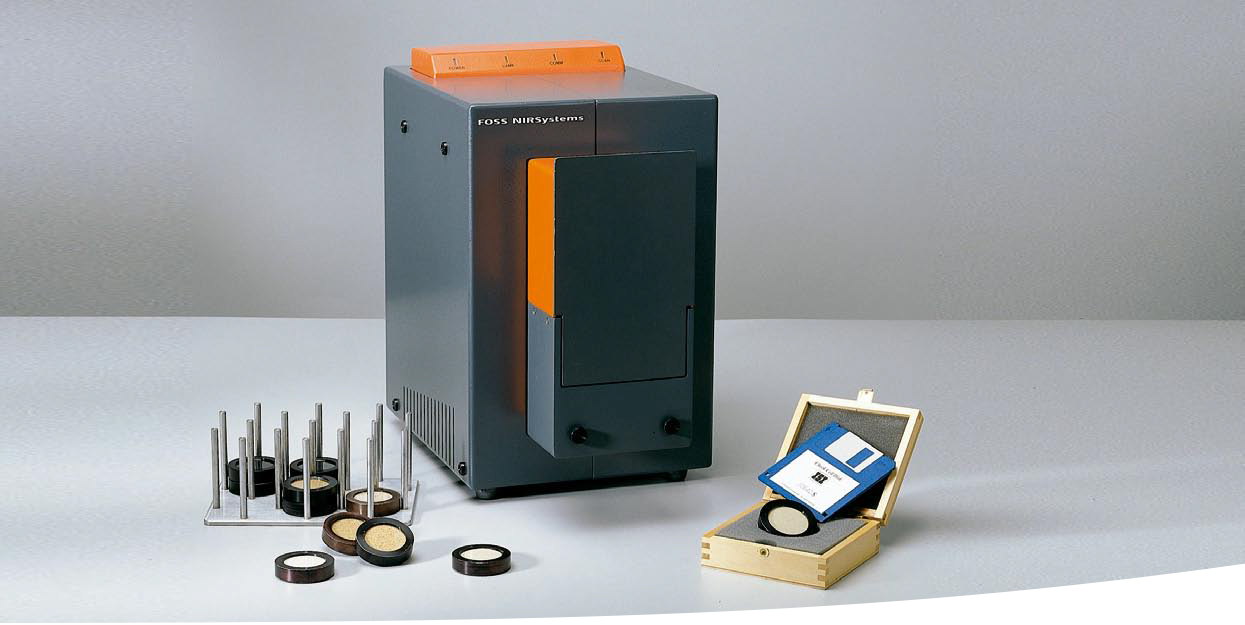
OUR EQUIPMENT
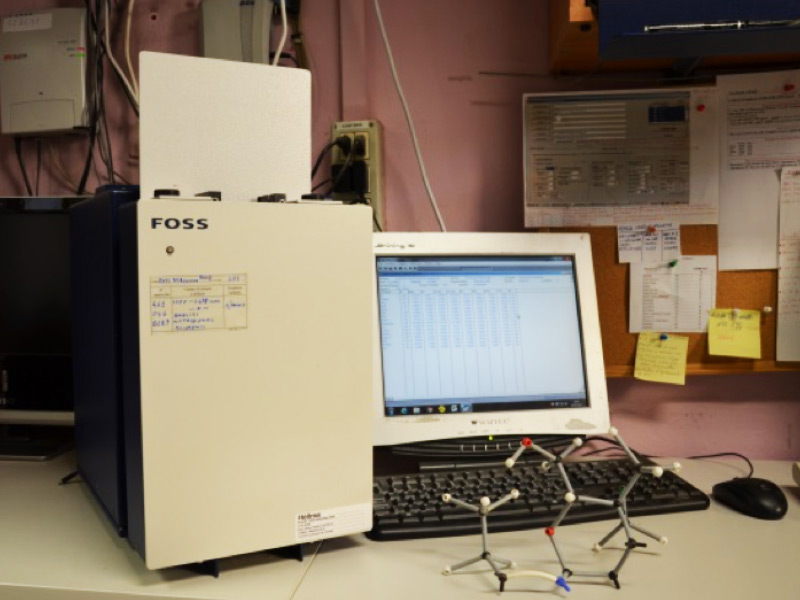
OUR EQUIPMENT
OUR EQUIPMENT
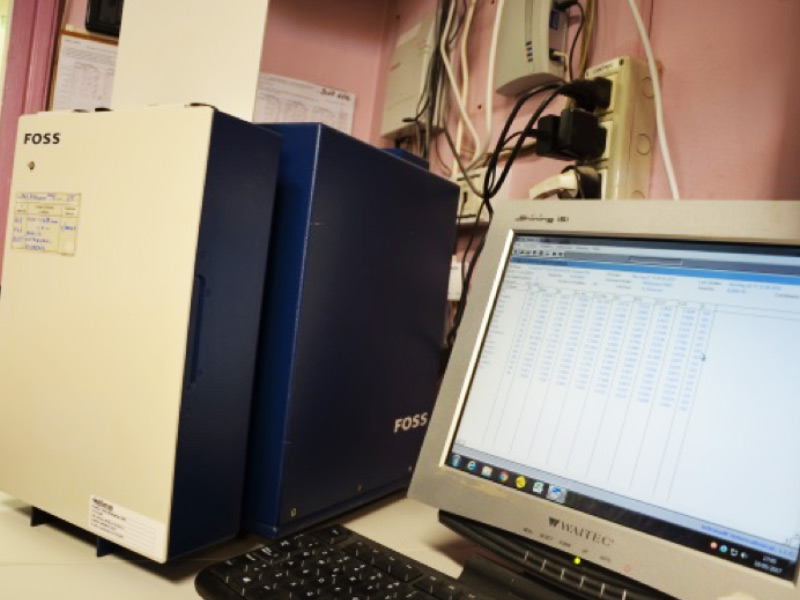
OUR EQUIPMENT
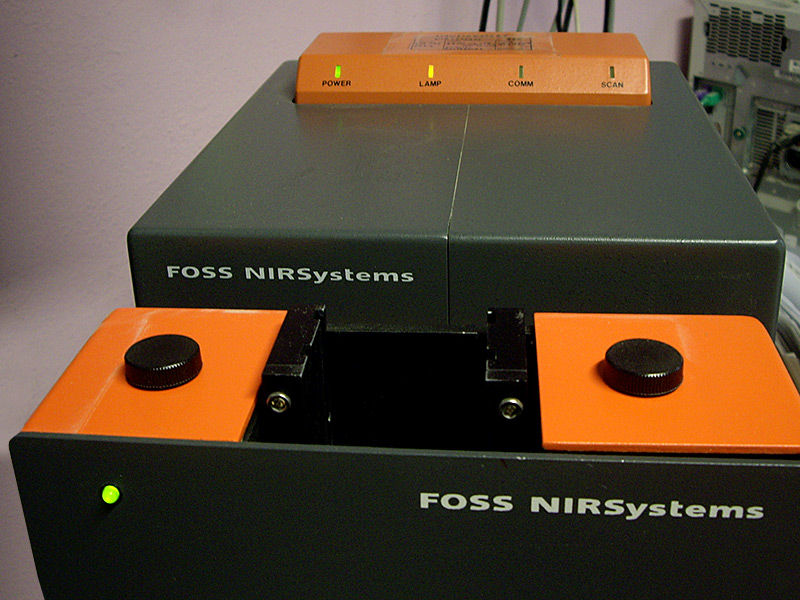
OUR EQUIPMENT
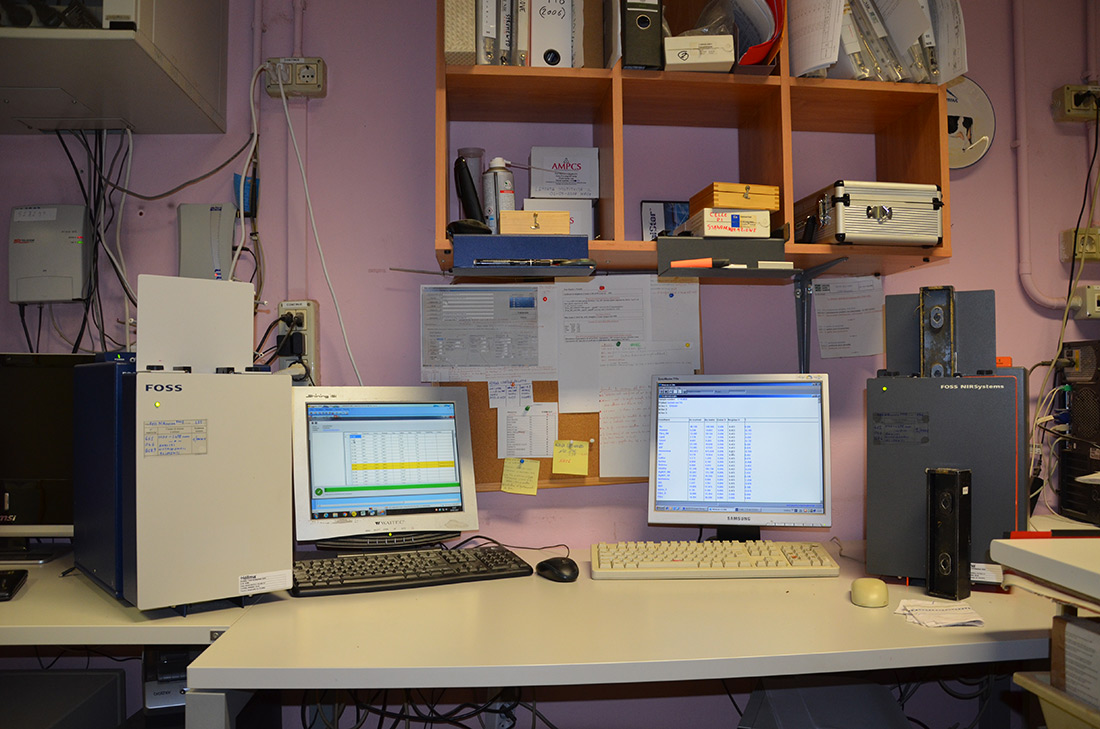
OUR EQUIPMENT
BREAKDOWN OF RESULTS
AND QUALITY INDEX
(NH, GH, T)
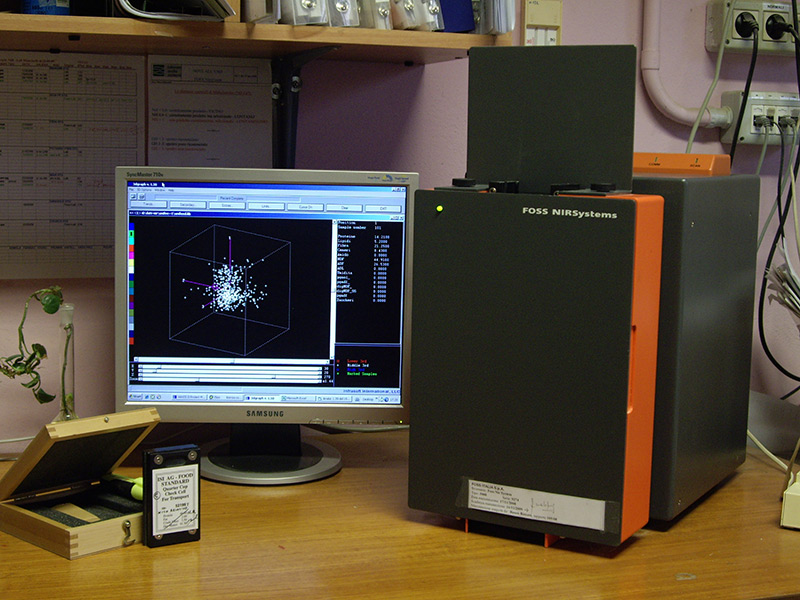
OBSERVATION GRAPH OF CORN SILAGE
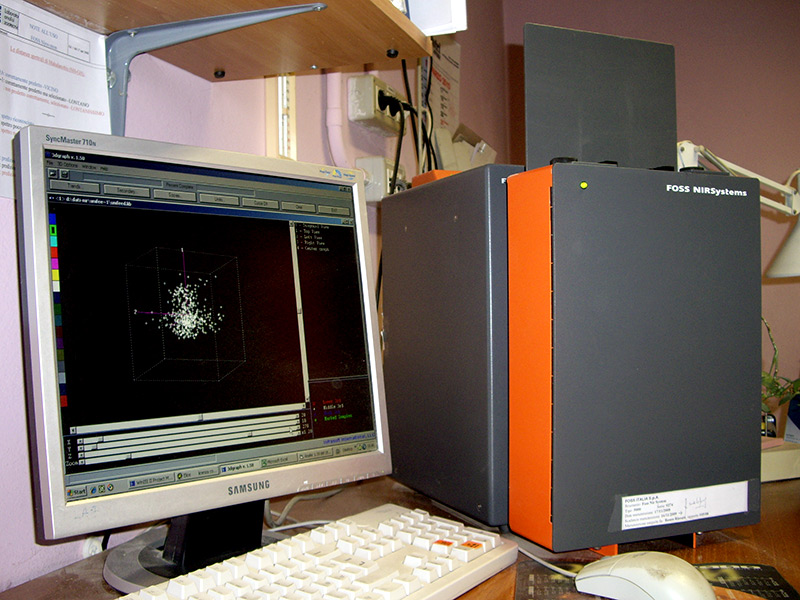
OBSERVATION GRAPH OF
CALIBRATED CORN SILAGE
3D RESULTS OF CALIBRATED CORN SILAGE
CORRELATION WITH WAVELENGTH
Are NIR results reliable?
“The quality of the NIR results reflects the quality of the baseline chemical used”
NIR analysis is a form of chemometrics in which classical chemistry is statistically linked to the physical behaviour of the material upon irradiation by a light beam.
To obtain reliable data, alongside the quantity of the baseline chemical, there is also a vital role for the algorithms employed to “recognise” a sample, compared to those present in the calibration curve.
These algorithms are the Mahalanobis distance (NH-GH).
Our laboratory uses:
NH < 0.6 to avoid similar/redundant spectra and GH < 1 to avoid anomalous spectra. The Student’s T-test for an accurate prediction of an individual parameter is < 2.5.
REQUEST FURTHER INFORMATION ON NIR TESTING
Tel. 0376.528295 | Fax 0376.528362 | E-mail info@lazoovet.it